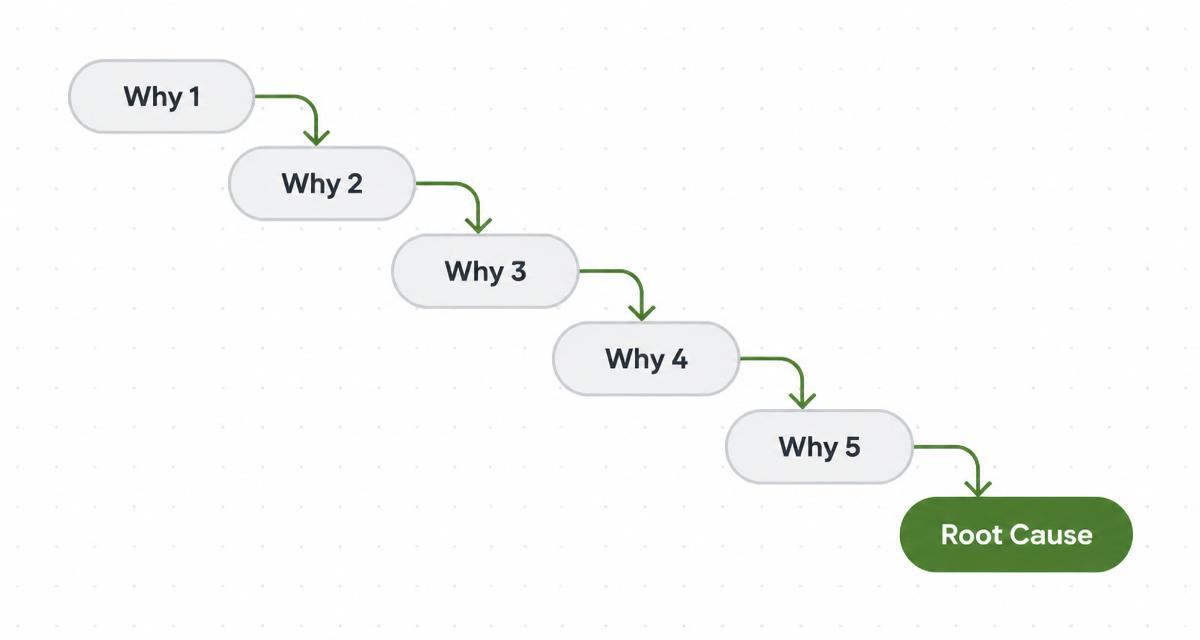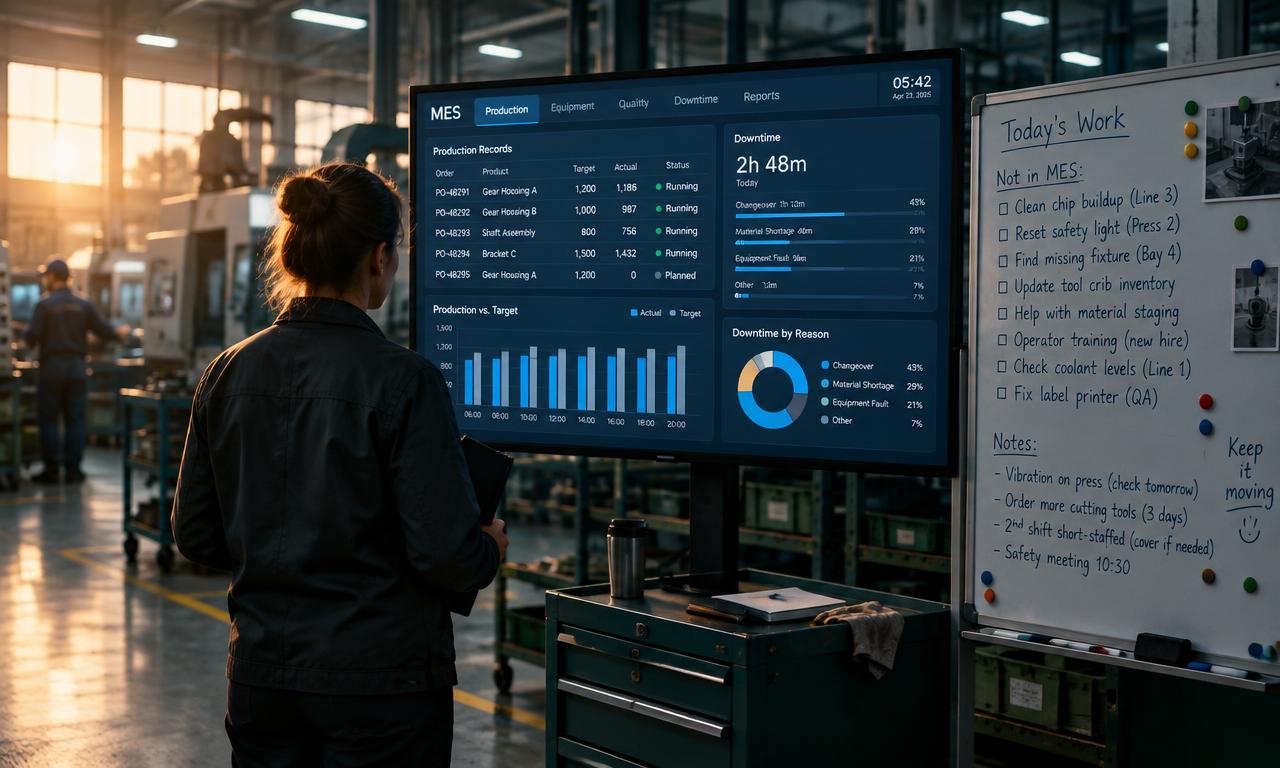
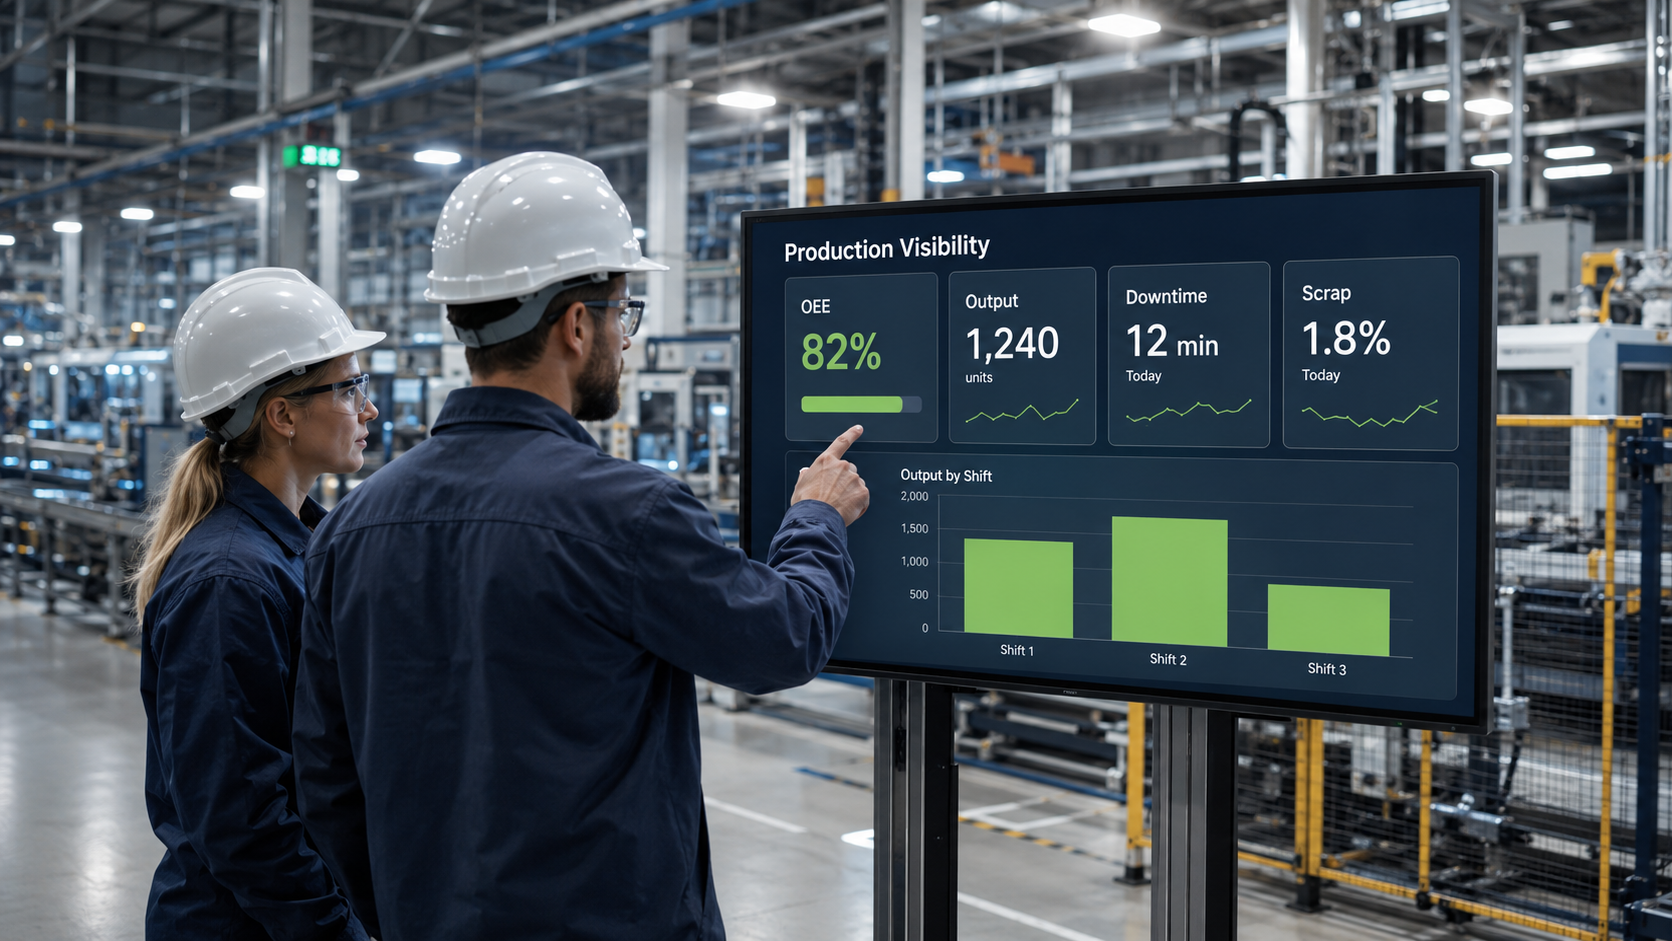
Almost no plant with a visibility problem is short of data. The reports exist, the dashboards are built, and somebody spends Sunday night refreshing them. What is missing is the distance between a number moving and anyone doing anything about it. Score yourself on the ten questions below, then see what that distance is costing you. Line 4 sits at 62%. It has sat at 62% for nine months. The report is accurate, the report is current, and the report has been read by everyone who needs to read it. The plant manager is not missing information. He is missing what happens after the information. And because the number is stable, nobody treats it as an incident. It is just what line 4 does. That is the shape of a visibility problem in 2026. Not a dark factory. A well-lit one where the light does not change anything.
Why 62% is four problems, not one
A line sitting below target is never a single fault. It is usually a changeover running eleven minutes past standard, a micro-stop lasting ninety seconds that nobody logs, a slow cycle on the number-two filler that the team stopped noticing two years ago, and a scrap rate that spikes on third shift. If your system cannot separate those four, the score is a mood rather than a measurement. And if it can separate them but nothing opens a work order, assigns an owner, or checks whether the fix held, then you have bought a very good thermometer for a building with no thermostat. The plants that move the number are not the ones with better charts. They are the ones where the loss becomes an owned action before the next shift starts.
The audit
Ten questions. Answer each one yes or no, about the plant you actually run rather than the one in the standard work. If you would need to check with someone before answering, that is a no.
Visibility: do you know now, or on Monday?
- You can see current OEE on any line right now, without asking anyone to run a report.
- The downtime clock starts from the machine, not from an operator's entry.
- A ninety-second micro-stop gets counted.
- Your maintenance and quality teams accept the reason codes. If either one disputes the numbers, that is a no.
Response: does the number change anything?
- When OEE drops below target at 2 a.m., something happens without a person deciding it should.
- There is one screen an operator glances at hourly without being told to.
- You know what percentage of last month's losses ended up with an owned action attached.
Memory: does the plant get smarter?
- When a fault repeats, the line knows it is a repeat before someone in the room says so.
- The corrective action from the last occurrence is findable in under a minute by whoever is on shift tonight.
- A fix that worked at one plant is findable by the other plants without somebody remembering to send an email.
What your score means
8 to 10. Your data is doing work. Your next gain is more likely to come from asset health or from daily management discipline than from another layer of reporting. 5 to 7. The most common result, and the one that funds the most dashboards. You can see the loss and you cannot reliably convert it into action. This shows up as a number that everyone knows and nobody moves. 0 to 4. You are reporting, not executing. More reporting will not fix this, and it is the direction most plants take next because it is the easiest thing to buy. The pattern worth sitting with: most plants score well on visibility and badly on memory. Visibility is what got purchased. Memory is what determines whether line 4 is still at 62% next year.
What the tiers look like side by side
| Capability | Spreadsheet | Dashboard tool | Execution platform |
|---|---|---|---|
| Real-time signal from the controller | No | Sometimes | Yes |
| Micro-stops counted | No | Partial | Yes |
| Loss tree editable per line | Manual | Limited | Yes |
| Work order opens automatically | No | No | Yes |
| Loss carries an owner and a date | No | No | Yes |
| Fix verified against the line | No | No | Yes |
| Repeat fault flagged as a repeat | No | No | Yes |
| Fixes findable across plants | No | No | Yes |
| Most plants are in column one or two and assume column three is a bigger version of what they have. It is not. The difference is not resolution, it is whether anything happens when nobody is watching. |
What it looks like when it holds
Italfarmaco went from kickoff to production in under three months, gained real-time shop-floor visibility on every shift, and used six months of the resulting data to justify new capital equipment. Read the full breakdown. Abafoods put 150 shop-floor users on the same platform, moved corrective actions from days to hours, and saw internal non-conformities fall with them. Read the full breakdown. Schneider Electric runs the model across 218 plants and over 110,000 users, and reports a 4 to 5% improvement in plant performance. Read the full breakdown. Across industrial plants Decisyon typically sees OEE up 3 to 5% in the first year and unplanned downtime down 20 to 30%. Most of the OEE gain comes from micro-stops the team did not know it was taking. Note what none of those three plants did. None of them fixed their reporting.
Four questions to ask any vendor in this category
Skip the chart configuration. Forty minutes of the demo will go there if you let it.
- Show me, live, what happens automatically when OEE drops below target at 2 a.m.
- Who edits the reason codes six months after go-live, and how long does it take?
- How do I report what percentage of last month's losses ended up with an owned, closed action?
- If this exact fault happened on a different line last quarter, how does the operator on shift tonight find out? If the answers are nothing, a consultant, you would have to build that, and they would have to ask around, you are buying a screen. If you are already past diagnosis and actively shortlisting, the OEE monitoring software buyer's guide covers the evaluation criteria in more depth.
Where Decisyon fits
Smart Gateway connects to the controllers, usually inside a day, including the legacy lines. Agentic MES turns the signal into a loss with a reason your maintenance team will accept. The part that closes the gap is what happens next. LOOP carries the loss into an owned action with a date, escalates it when it stalls, and checks it against the line rather than against a checkbox. Process Conformance watches live operations against your defined standards and flags the deviation as it happens rather than in next week's review. Fix Finder reads incident and corrective-action history across every connected plant and routes the fix that already worked to the operator standing at the line right now. All three are how the number stops being a report. What a plant feels a quarter later is shorter repair times, fewer repeats, and a cost per unit that finally moves. See your number in the ROI Report → · Read the customer results →