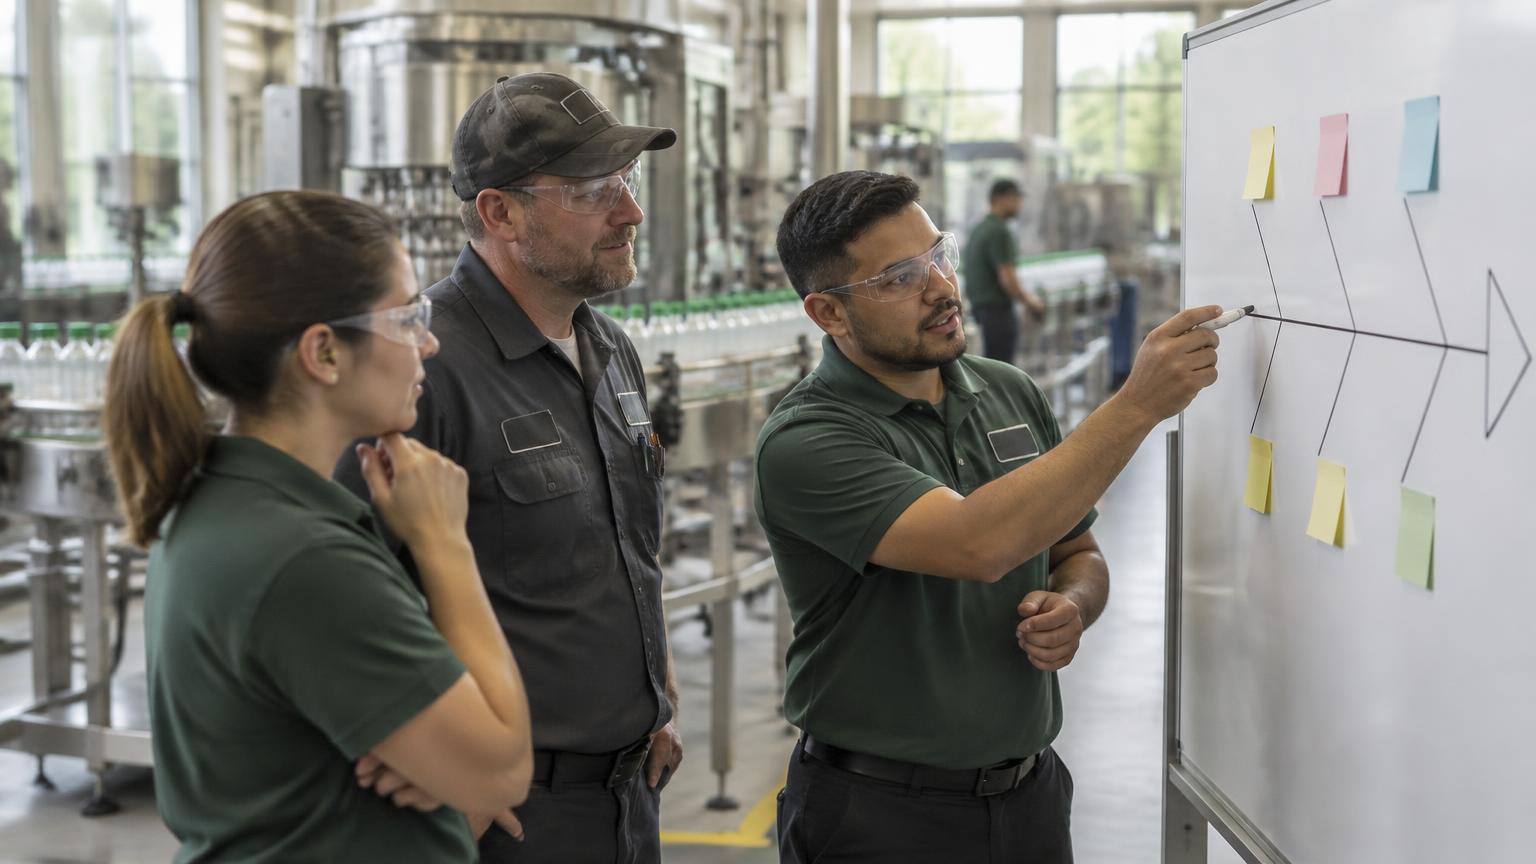
A fishbone diagram for manufacturing is a one-page map of every possible cause behind one problem, sorted into six buckets: Man, Machine, Method, Material, Measurement and Mother Nature (environment). The team writes the problem at the head, brainstorms causes on each bone, then tests the two or three most likely ones on the floor. An AI Workforce can gather the records and keep the tests moving, while the team checks what is true. Download the free template below, run it in 30 minutes, and see what fixing the top cause is worth in the ROI Report.
Download the free fishbone diagram template (Excel) →
Consider an illustrative cap-reject investigation. It is 7:10 a.m. Line 3 has rejected 4% of caps for the third night running. The maintenance lead says the torque head is fine. The quality tech blames a new resin lot. The night supervisor thinks the new hire is loading it wrong. Everyone has a theory and nobody has a picture.
That is the moment a fishbone diagram earns its place. It doesn't solve the problem. It stops the team from arguing about one cause while ignoring five others.
What a fishbone diagram actually does
Kaoru Ishikawa designed it in the 1960s for exactly this situation: a quality problem with many possible causes and a team that each sees only part of it. The diagram forces three things:
- One problem, stated precisely. "4% cap rejects on Line 3, night shift, since Oct 1," not "quality issues."
- Every cause gets a place to land. The six buckets make people think past their own department.
- A short list to test. You leave with two or three causes to check, not a vague action to "look into it."
It pairs naturally with a Pareto chart. The Pareto tells you which problem to attack first. The fishbone tells you why that problem keeps happening.
The 6M categories, with plant-floor prompts
| Bone | What to ask | Example causes (cap rejects) |
|---|---|---|
| Man (people) | Who ran it, how trained, which shift? | New hire on night shift, no sign-off on changeover |
| Machine | Which asset, last maintenance, any alarms? | Torque head calibration overdue, worn chuck |
| Method | Is the work instruction current and followed? | Changeover sheet still shows old resin settings |
| Material | Supplier, lot, storage conditions? | New resin lot from second supplier |
| Measurement | Is the gauge right and read the same way? | Vision system threshold changed last week |
| Mother Nature | Temperature, humidity, time of day? | Plant runs 4°C cooler overnight |
How to run one in 30 minutes
- Write the problem at the head. Include line, shift, metric and start date.
- Bring the people who touch it. One operator, one maintenance tech, one quality tech, one supervisor. Four is enough.
- Fill each bone for 10 minutes. No debating yet. Every cause goes up.
- Ask "why" two or three times on the strongest causes. "Calibration overdue" becomes "the PM task was never scheduled after the head was swapped."
- Circle two or three causes to test. Pick ones you can check this week.
- Give each test an owner and a date. Without this step the diagram goes in a drawer.
Why most fishbones don't change anything
Operational Excellence starts with fewer repeat defects, not a completed diagram. An AI-Powered System of Execution keeps the evidence, assigned test and result connected so the next shift does not restart the same investigation.
- The causes are opinions, not evidence. Nobody checks the maintenance log or the lot record before circling.
- The test never gets assigned. The session ends with agreement and no owner.
- Nobody checks whether the fix held. The same rejects come back in six weeks and the team draws the same diagram.
- The next plant starts from zero. A sister site with the same capper solved this last year and nobody knows.
What changes when the evidence and the follow-up are handled for you
The diagram is still a team exercise. What changes is the work around it. An AI Workforce turns Factory Data from logs and quality holds into Manufacturing Intelligence the team can check. LOOP carries the resulting tests into Operational Execution. Operational Excellence means the reject rate stays down after the fix, not just that the task was closed.
Before the session, Deep Find reads the maintenance history, shift notes and quality holds for Line 3 and lists what was recorded the last time cap rejects spiked, with the source attached, so the team starts with evidence instead of memory. Fix Finder checks corrective-action records across plants and shows the fix that held on a similar capper, so the team knows whether this is a solved problem.
After the session, the circled tests become owned actions in LOOP, the daily management tool Decisyon built for tier meetings and follow-up. Meeting Insight brings any overdue test back to the next tier meeting so it can't quietly expire. When the fix is in, the team checks the reject rate against the baseline, which is the step most plants skip. Our guide on how to verify a corrective action worked covers that check.
What this looks like at scale
Schneider Electric runs daily management on LOOP across its plants, used every day by 100% of employees in scope. Plant performance improved 4–5%, with faster issue identification and escalation. As Philippe Sola, Plant General Manager at Carros, put it: "We have improved our reactivity, with the possibility of escalating priority actions during the course of the day."
Read the full breakdown. Then estimate your plant's number in the ROI Report.
Paper, spreadsheet or system: how the options compare
| Whiteboard / paper | Excel template | Daily management system | |
|---|---|---|---|
| Fast to start | Yes | Yes | Yes, once set up |
| Evidence attached to causes | No | Manual | Pulled from logs |
| Tests assigned with owner and date | Rarely | Sometimes | Always |
| Overdue tests resurface | No | No | Yes, at the next tier meeting |
| Visible to other plants | No | Only if emailed | Searchable |
Start with the free template. Move to a system when the same problems keep coming back.
What to ignore, and three questions to ask
Ignore the debate about whether you need 6M or 8M (adding Management and Maintenance). Use whatever buckets get your team talking.
Ask instead:
- Did we check at least one record for every cause we circled?
- Does every test have one owner and a date this week?
- When will we look at the metric again to see if the fix held?
Where Decisyon fits
The fishbone identifies hypotheses to test. LOOP connects the owner, test, verification and reusable fix so the next shift does not start from memory. That is how the AI Workforce supports Operational Excellence on the floor.
Decisyon is building the AI-Powered System of Execution for Manufacturing. Our Agentic Platform combines an AI Workforce, Agentic MES, Industrial Intelligence, and Operational Memory to transform manufacturing intelligence into operational excellence.
See what that is worth on your line in the ROI Report, or browse the case studies.