
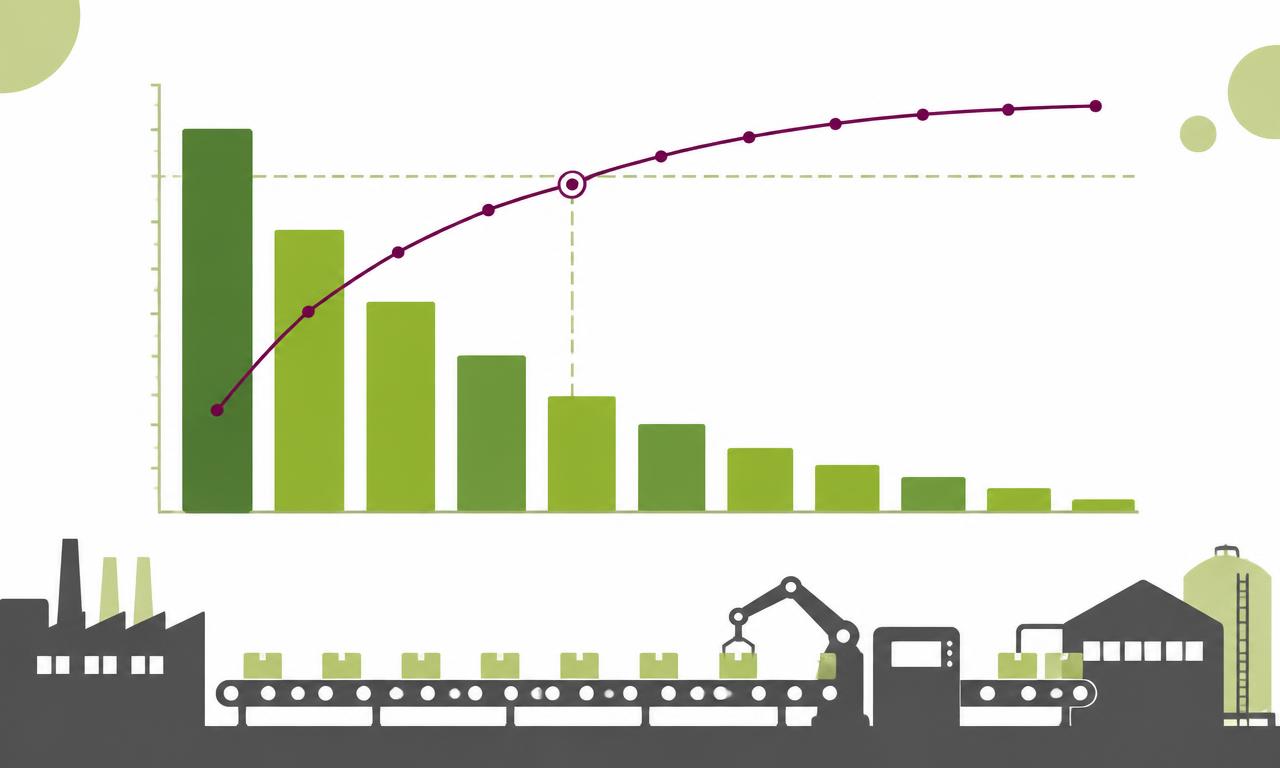
A Pareto chart ranks your downtime or scrap causes from biggest to smallest and shows where 80% of the loss comes from. On most lines, that's two to four causes out of dozens. Download the free template below, paste in two to four weeks of stop codes, and it sorts the causes and draws the 80% line for you. Those causes are next month's shift meeting agenda.
Download the free Pareto chart template (Excel / Google Sheets) →
What a Pareto chart shows
Bars ranked largest to smallest, with a line showing the running total as a percentage. Where the line crosses 80%, stop reading. Everything to the left is worth a shift's attention. Everything to the right can wait.
Read it in this order:
- The line first. Two or three bars to reach 80% means a sharp, fixable problem. Eight or nine means your stop codes are too vague to trust.
- Then the tallest bar. One good action on that cause pays back faster than anything else on the chart.
- Then the units. Minutes, scrap units, or count of events. Never mix them.
The most common mistake is charting how often a stop happens instead of how many minutes it costs. Ten one-minute micro-stops look worse than one 90-minute breakdown, and the chart sends the team to the wrong fix.
How to build one in five steps
- Pick one loss. Downtime minutes, scrap units, or defects. Choose the one your plant is measured on this quarter.
- Pull two to four weeks of data for one line. Less is noise. More hides what changed.
- Paste codes and totals into the template. It sorts them, calculates the cumulative percentage, and marks every cause left of 80%.
- Give each marked cause one owner and one date. No owner means no action.
- Re-run the chart after the fix. Same line, same loss, same window. If the bar didn't shrink, the action didn't work.
Worked example: one packaging line, three weeks
Illustrative figures from a two-shift packaging line, charted in minutes lost.
| Cause | Minutes lost | Cumulative % |
|---|---|---|
| Film jam | 420 | 35% |
| Changeover overrun | 300 | 60% |
| Label sensor fault | 180 | 75% |
| Material shortage | 120 | 85% |
| Other (11 codes) | 180 | 100% |
Three causes carry 75% of the lost minutes. The maintenance lead took film jams, the shift supervisor took changeovers, and the controls tech took the label sensor. If you want a dollar figure on what that top bar costs every quarter you wait, the cost of inaction guide walks through the math in about ten minutes.
Where Pareto charts fall short
- They're late. Built by hand from last week's logs, so the meeting argues about data instead of fixes.
- They show what, not why. You still need root cause work: fishbone, 5 Whys, or an A3.
- Nobody checks the loop. Actions get assigned, and the chart rarely gets re-run to prove the bar moved.
From chart to closed action
The chart is where raw stop codes turn into a decision. The payoff comes when every bar left of 80% has an owner, the fix gets verified, and the same cause doesn't show up next month. That's the difference between a plant that reports downtime and one that runs an AI-Powered System of Execution.
In practice, that means three jobs get done without a spreadsheet:
- Before the meeting, Meeting Insight builds the Pareto from live stop codes on each line and puts it in front of the supervisor, so the meeting starts on the fix.
- During root cause, Fix Finder searches past corrective actions across lines and plants and shows the fix that worked last time a film jam hit the same machine type.
- After the fix, the chart re-runs on the same window and the owner sees whether the bar shrank.
To see what closing your top three causes is worth on your lines, run the free ROI report. It takes about a minute.
Where Decisyon fits
Decisyon's LOOP puts the Pareto, the owner, and the verified fix in one place, run by an AI Workforce that works alongside your supervisors and CI leads. The AI-Powered System of Execution turns Factory Data into Manufacturing Intelligence, carries it into Operational Execution, and gives teams a measurable path toward Operational Excellence.
About Decisyon — Decisyon is building the AI-Powered System of Execution for Manufacturing. Our Agentic Platform combines an AI Workforce, Agentic MES, Industrial Intelligence, and Operational Memory to transform manufacturing intelligence into operational excellence.