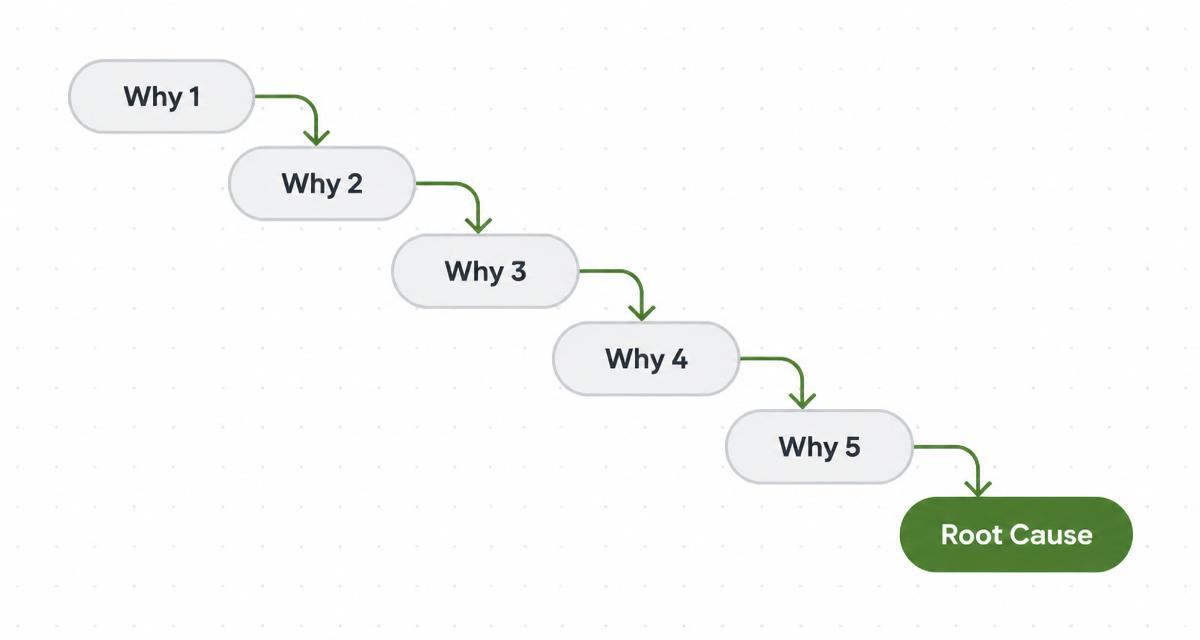
A 5 Whys analysis asks "why" until you reach a cause you can fix and verify, usually in three to five steps. It works best on one specific failure, with the people who saw it, within 24 hours. If repeat failures are costing you shifts, see what they add up to with the free ROI Report.
Why most 5 Whys sessions stop too early
Most teams stop at the first answer that names a person or a part. "The operator skipped the check" is not a root cause. It is a symptom of a process that let the check be skipped.
A useful test: if you fix this cause, would the failure still be possible tomorrow? If yes, keep asking.
How to run it, step by step
- Write the problem as a fact. What failed, where, when, by how much. "Filler 3 stopped 4 times on night shift Tuesday, 52 minutes total."
- Bring the people who were there. The line lead, the maintenance tech on call, the quality tech. Not just supervisors.
- Ask why once, and write the answer down only if someone can show evidence: a log entry, a photo, a reading.
- Repeat until the answer is a process, a standard, or a design you control.
- Assign one countermeasure, one owner, one due date.
- Set a check date. Two weeks later, look at the same machine and the same measure. Did the stops come back? Here is how to verify a corrective action worked.
A worked example
| Why? | Answer |
|---|---|
| Why did filler 3 stop? | The capper jammed. |
| Why did the capper jam? | Caps arrived misaligned from the chute. |
| Why were they misaligned? | The chute guide had worn past tolerance. |
| Why was a worn guide still in service? | It is not on the preventive maintenance list. |
| Why not? | The list was written before this cap format was introduced. |
Countermeasure: add the guide to the weekly check. Owner: maintenance planner. Due: Friday. Check date: two weeks.
When 5 Whys is the wrong tool
If three or four causes are plausible at once, a single chain of whys will follow one and miss the others. Map the candidates first with the free fishbone diagram template, then run 5 Whys on the branch the evidence supports.
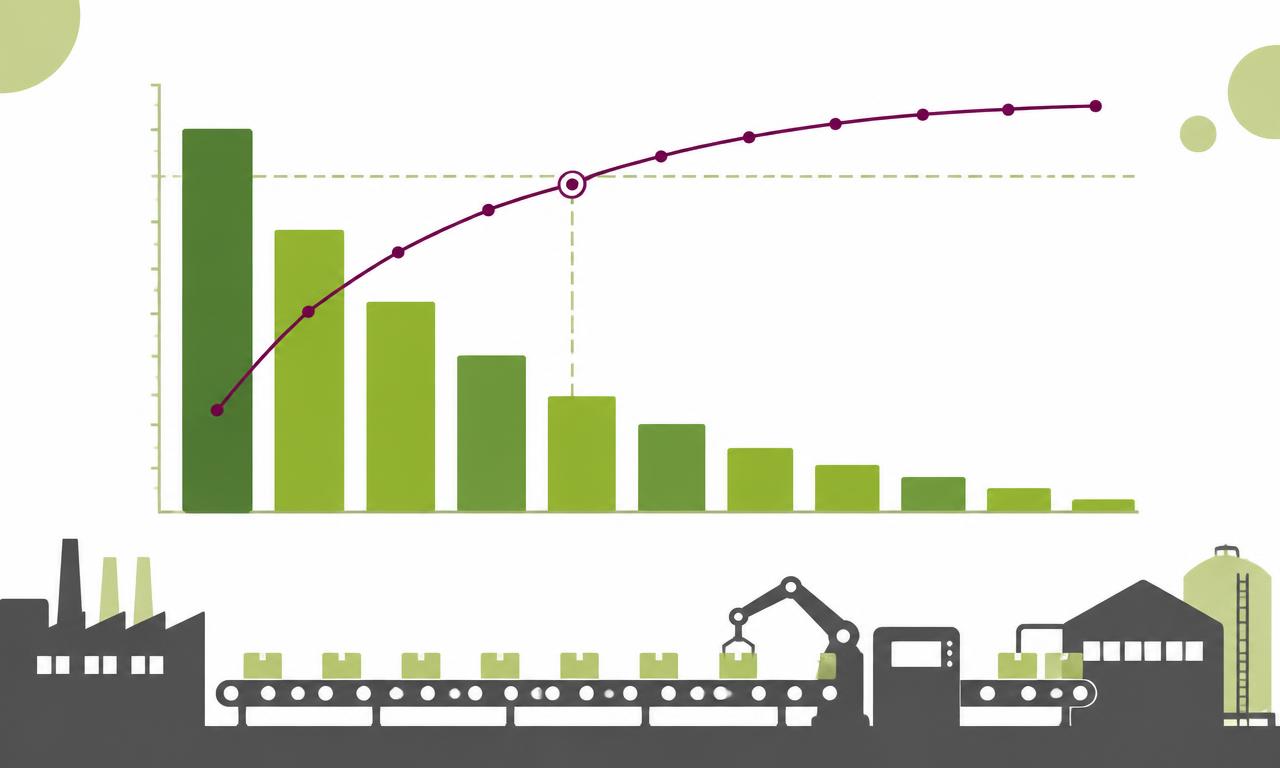
If you do not yet know which problem matters most, rank your losses first with the free Pareto chart template.
Keeping the fix from fading
The analysis is the easy part. The hard part is knowing, six weeks later, whether anyone still follows the new standard.
In Decisyon, Fix Finder reads corrective-action history across plants and shows the line lead the fix that already worked on the same failure elsewhere, before the session starts. Meeting Insight tracks the countermeasure owner and due date from the daily meeting and flags it to the area manager if the check date passes with no result.
To see what repeat failures cost your plant each year, run the free ROI Report.