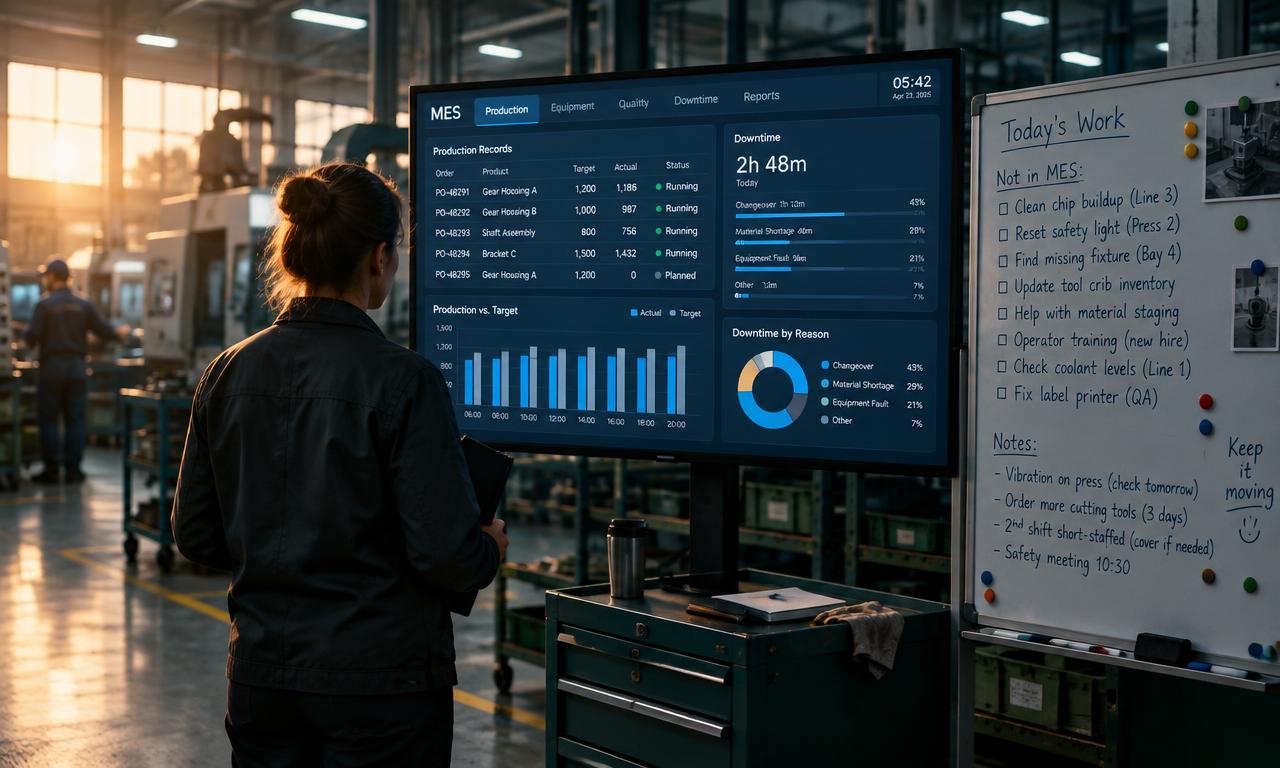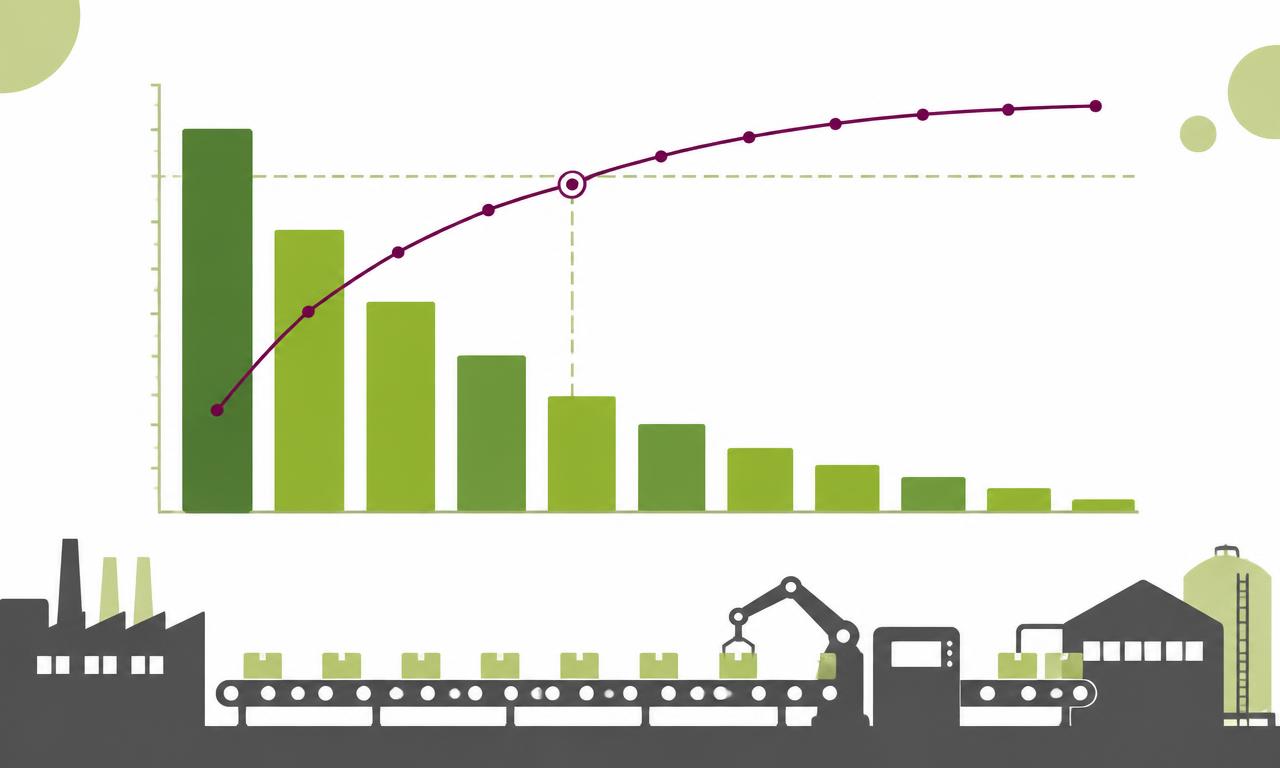
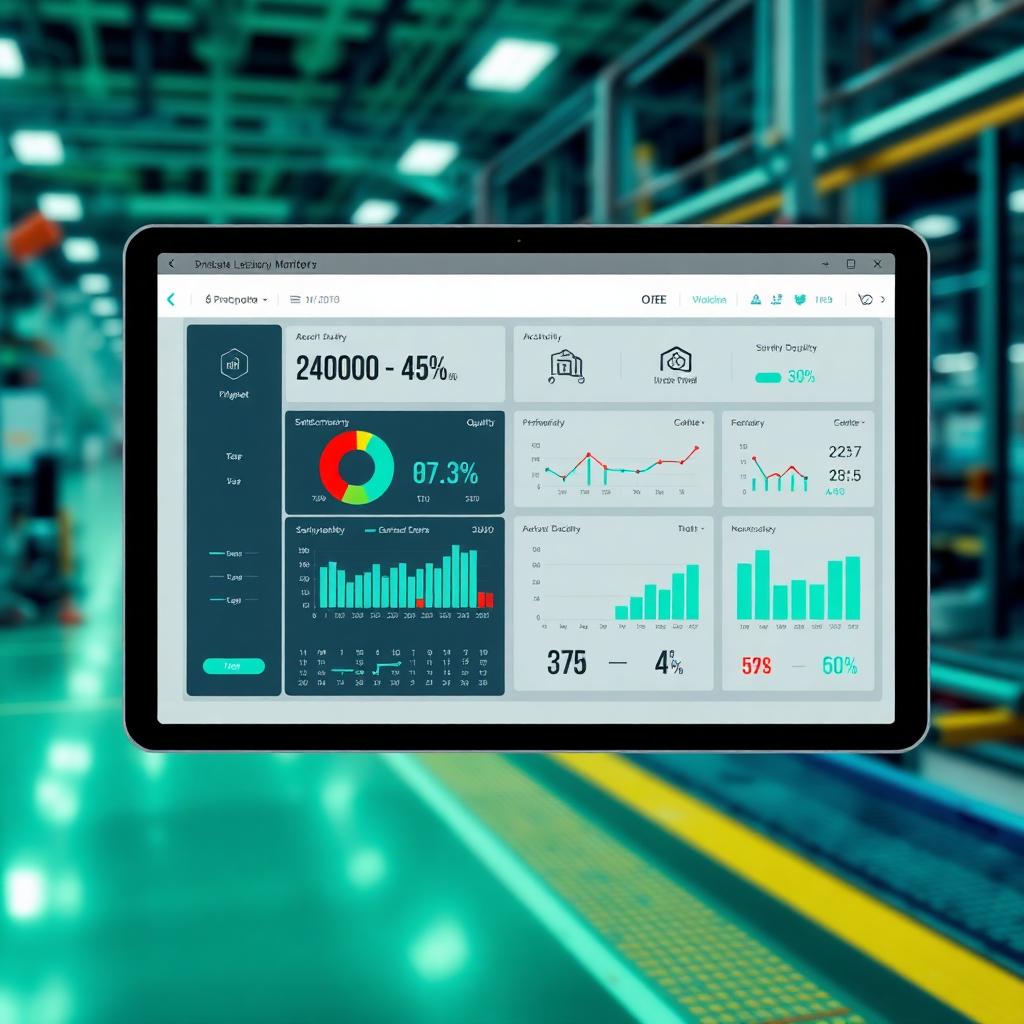
Good OEE software takes its numbers straight off the machines, splits every lost minute into a reason the maintenance and quality teams accept, and does something about it before the next shift starts. Most tools stop at the number. The ones worth paying for open the work order, escalate the miss, and have the morning meeting prepped before anyone walks into the room. See what those minutes are worth on your line before you shortlist anyone.
Picture a plant manager in Ohio pulling up his OEE report. Beautiful thing. Twelve tabs, color coded, updated every Monday by a process engineer who spends most of Sunday night building it. Line 4 sits at 62%. It has sat at 62% for nine months.
He is not missing data. He is missing what happens after the data. That gap is the whole buying decision, and most OEE software evaluations never get near it because the demo spends forty minutes on chart configuration.
Vendors sell the same category under two names. OEE software and OEE monitoring software mean the same thing on a price list. The difference that matters on the floor is whether the tool only watches the number or also moves the work.
What the number is actually telling you
OEE multiplies three things: availability, performance, quality. Run it by asset, by line, by shift, by product, and it tells you where output is leaking. That is genuinely useful and it is also the easy part. Every vendor in the category can produce the score.
The hard part is the minute-by-minute honesty underneath it. A plant at 62% is not one problem. It is a changeover that takes eleven minutes longer than the standard, a micro-stop nobody logs because it lasts ninety seconds, a slow cycle on the number-two filler that everyone has stopped noticing, and a scrap rate that spikes on the third shift. If the software cannot separate those four, the score is a mood, not a measurement.
Five things that separate real OEE software from a screen
1. The data comes off the machine, not off a clipboard
If an operator types in downtime, the timestamps are wrong. Not slightly wrong. Wrong in the direction that hides the problem, because nobody logs the ninety-second stop and everybody rounds the twenty-minute one down to fifteen.
Ask what protocols the tool speaks natively: OPC UA, Modbus, Ethernet/IP, Siemens S7, MQTT for the newer lines. Ask whether the connector runs at the edge or needs a server room. Manual entry is fine for the reason a machine cannot see. It is never fine for the clock.
2. Reason codes your maintenance team will sign off on
OEE is a negotiation between operations, maintenance and quality. If the loss categories ship fixed from the vendor and cannot be edited per line, maintenance will dispute the numbers within a month and the program is over. You want an editable loss tree, a quick-tap interface at the line, and an auto-assign rule for the causes the signal already makes obvious.
The test question in the demo: after go-live, who edits the reason codes, and how long does it take? If the answer involves a consultant, keep looking.
3. One screen an operator actually glances at
Not a business intelligence canvas with twelve tiles. Current OEE, target, biggest loss this shift, next action. Four things. If the operator does not look at it once an hour without being asked, the license is decoration.
4. Something happens when the number moves
This is the criterion that separates the shortlist. Watching OEE fall is not a capability. The tools worth money open a work order in maintenance when availability drops, escalate to the supervisor when performance drifts past a threshold, hold the lot when scrap trips a limit, and build the morning meeting summary out of the last 24 hours of losses so nobody assembles it at 5 a.m.
This is also where the "AI-powered" claim on the box either means something or doesn't. Ask what the agent actually reads and what it hands back. A useful version looks like this: when a fault code opens on line 4, the system searches every prior incident with that same code — across every plant, not just this one — and surfaces the corrective action that already closed it, routed straight to the operator on shift. That is a faster mean-time-to-repair, not a prediction. It is also the difference between an operator re-diagnosing a problem the plant already solved eight months ago on a different line, and an operator fixing it in the time it takes to read a notification. If a vendor cannot describe what their agent reads and what it routes, they are selling the word "AI," not the capability.
5. It plugs into the systems you already run
OEE without context is trivia. The tool needs to read the work order, product and planned rate from the MES, write back to maintenance, and feed the warehouse so finance can put a cost against a lost hour. Standalone OEE point tools become another silo inside six months, and then somebody builds a spreadsheet to reconcile them.
What the tiers look like side by side
| Capability | Spreadsheet | Dashboard tool | OEE platform |
|---|---|---|---|
| Real-time signal from the controller | No | Sometimes | Yes |
| Loss tree you can edit per line | Manual | Limited | Yes |
| Work order opens automatically | No | No | Yes |
| Cross-plant fix lookup on repeat faults | No | No | Yes |
| Morning meeting prepped for you | No | No | Yes |
| Verified that the fix held | No | No | Yes |
| Connected to MES, maintenance, finance | No | Partial | Yes |
Most plants are in column one or two. The move to column three typically returns three to five OEE points in the first quarter, and almost all of it comes from micro-stops the team did not know it was taking.
What it looks like when it holds
Schneider Electric runs this model across 218 plants with thousands of daily users and reports a 4 to 5% improvement in plant performance, driven by faster follow-through and by one site being able to see what another already fixed. Read the full breakdown.
Abafoods moved corrective actions from days to hours with 150+ shop-floor users on the same platform, and internal non-conformities dropped with them. Read the full breakdown.
Neither result came from a better chart. In both cases the action stopped depending on someone remembering it. Estimate what that is worth on your lines.
Ignore this in the demo
Heat maps. Anomaly scores. Failure curves with no work order behind them. Those matter later, once the basics run clean.
Four questions instead:
- How long until my first line is connected and reporting, in days?
- Who edits the reason codes six months after go-live?
- Show me, live, what happens automatically when OEE drops below target at 2 a.m.
- If this exact fault happened on a different line last quarter, how does the operator on shift tonight find out?
If the answers are weeks, a consultant, nothing, and "they'd have to ask around" — you are buying a screen.
If the evaluation is really about asset health and failure prediction rather than lost minutes, the APM software vendors comparison covers that side of the market.
Where Decisyon fits
Smart Gateway connects to the controllers, usually inside a day. Loop carries the loss into an owned action, escalates it when it stalls, checks it against the number, and makes the fix findable at the next plant — that cross-plant lookup runs through Fix Finder, one of the five agents in the Decisyon AI Workforce, which reads incident and corrective-action history across every connected plant and routes the proven fix to whoever is standing at the line right now. The operator view runs on the tablets already on the floor.
What the plant feels a quarter later is the point: shorter repair times, fewer repeats, and a cost per unit that finally moves. See your number in the ROI Report → · Read the customer results →